Replaces each region of a map with a hexagon of equal size. The hexagons tile the outline of the map, and regions are allocated hexagons by minimising the total squared displacement of all regions (from where the layout moves them), so regions keep their relative positions.
Usage
hexmap(
  object,
  group = NULL,
  layout = layout_hierarchy(),
  island_gap = 0.5,
  group_gap = 0.1,
  crs = NULL
)
Arguments
- object
An sf object, or a geometry column (sfc), of regions in a projected or longitude/latitude coordinate reference system.
- group
Optionally, the group of each region (e.g. states), as a column of
objectgiven unquoted (group = state) or as a string (group = "state"), or as a vector with one value for each region.- layout
How the hexagons (and groups) are arranged, as a layout function such as
layout_hierarchy()(the default),layout_diffusion(),layout_compact()orlayout_slice(), optionally wrapped inlayout_repair()to fix which groups touch.- island_gap
The distance, in hexagon widths, beyond which landmasses are tiled as separate islands. Use
Infto tile all land together.- group_gap
The width of the gap between groups, as a fraction of the hexagon width. The hexagons along group borders are trimmed to make this gap, so they are slightly smaller than other hexagons. Only used with
group.- crs
The projected coordinate reference system to make the hexagons in, such as the one the map will be plotted in.
objectis transformed tocrswithsf::st_transform(). Defaults to the CRS ofobject, or for longitude/latitude input, to a Lambert azimuthal equal-area CRS centred on the data ("+proj=laea +lat_0=... +lon_0=...").
Value
For an sf object, object with its geometry replaced by hexagons, keeping
all of its other columns and the order of its rows, so the hexagons can be
joined to or compared with the original regions. For a geometry column, a
geometry column of hexagons in the same order, so hexmap() can be used
within dplyr::mutate() to add the hexagons as another geometry column.
The hexagons are in the coordinate reference system they were made in.
Details
Landmasses that are further apart than island_gap hexagon widths are
tiled separately, with one hexagon for each region on that landmass. Their
hexagons are separated by at least one empty hexagon, so islands such as
Tasmania remain distinct from the mainland.
The hexagons are arranged by layout. When group is given, the hexagons
of each group (e.g. state) are kept contiguous and a gap of group_gap
hexagon widths is cut along the borders between groups, so that each group
is visually distinct. Groups usually need a very different area of
hexagons than they cover on the map, so the map is distorted to fit them,
and each layout distorts it differently. By default, the groups are laid
out first, keeping each group's shape and touching the groups it borders on
the map, and the regions are then placed within each group. Without
group, all regions form a single group, so the layout only sets the
shape of the hexagons and where regions are placed within them. See
layouts for the available layouts, and vignette("layouts") for how
they compare. Grouping works best for groups that are spatially
contiguous, such as states.
The hexagons are regular and equally sized in the coordinate reference
system (CRS) they are made in, which is the CRS of object unless crs is
given, or a Lambert azimuthal equal-area CRS centred on the data for
longitude/latitude input. The hexagons keep their location when plotted in
another projection, but are stretched by it, so make the hexagons in the
CRS you will plot in. Use an equal-area CRS for hexagons that also cover
equal areas on the ground. See vignette("projections") for details.
See also
layouts for how the hexagons are arranged.
Examples
library(sf)
#> Linking to GEOS 3.12.1, GDAL 3.8.4, PROJ 9.4.0; sf_use_s2() is TRUE
# The 2025 Australian federal election, in the Australian Albers projection
election <- st_transform(aus_election_2025, 3577)
# A hexagon for each electoral division
election_hex <- hexmap(election)
# Every column of the map is kept, in the same order
head(election_hex)
#> Simple feature collection with 6 features and 3 fields
#> Geometry type: POLYGON
#> Dimension: XY
#> Bounding box: xmin: -1153976 ymin: -3817828 xmax: 1522580 ymax: -2272518
#> Projected CRS: GDA94 / Australian Albers
#> # A tibble: 6 × 4
#> division state party geometry
#> <chr> <chr> <chr> <POLYGON [m]>
#> 1 Adelaide SA ALP ((-788991 -2553483, -910652.6 -2483242, -910652.6 -23427…
#> 2 Aston VIC ALP ((427625.3 -3396380, 305963.7 -3326138, 305963.7 -318565…
#> 3 Ballarat VIC ALP ((-1032314 -3396380, -1153976 -3326138, -1153976 -318565…
#> 4 Banks NSW ALP ((1279257 -3607104, 1157595 -3536863, 1157595 -3396380, …
#> 5 Barker SA LP ((-788991 -2974932, -910652.6 -2904690, -910652.6 -27642…
#> 6 Barton NSW ALP ((1400918 -3817828, 1279257 -3747587, 1279257 -3607104, …
# \donttest{
# Keep the divisions of each state together (takes a few seconds)
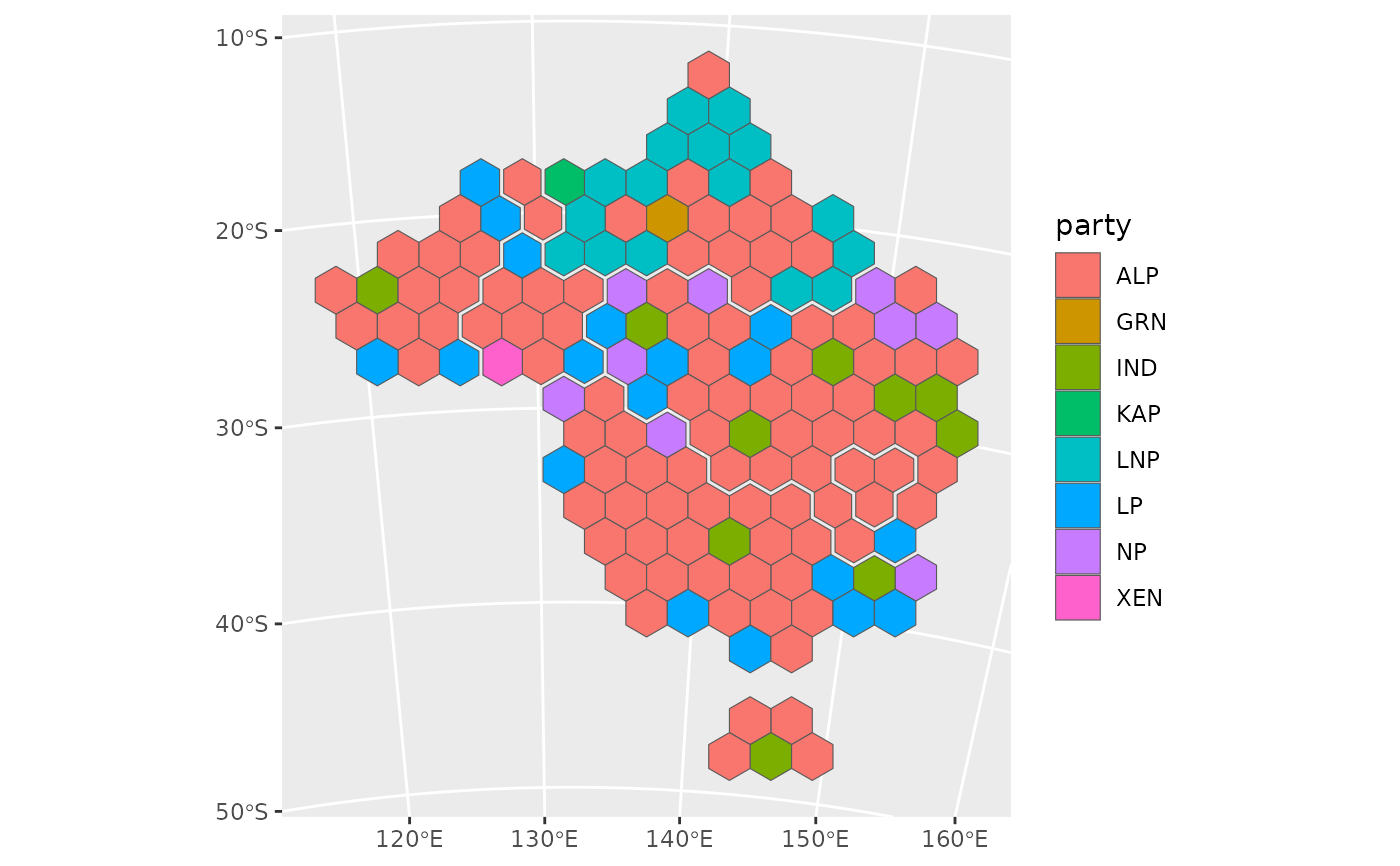
election_hex <- hexmap(election, group = state)
# }
library(ggplot2)
ggplot(election_hex) +
geom_sf(aes(fill = party))
 # \donttest{
# Hexagons made for a globe centred on Australia
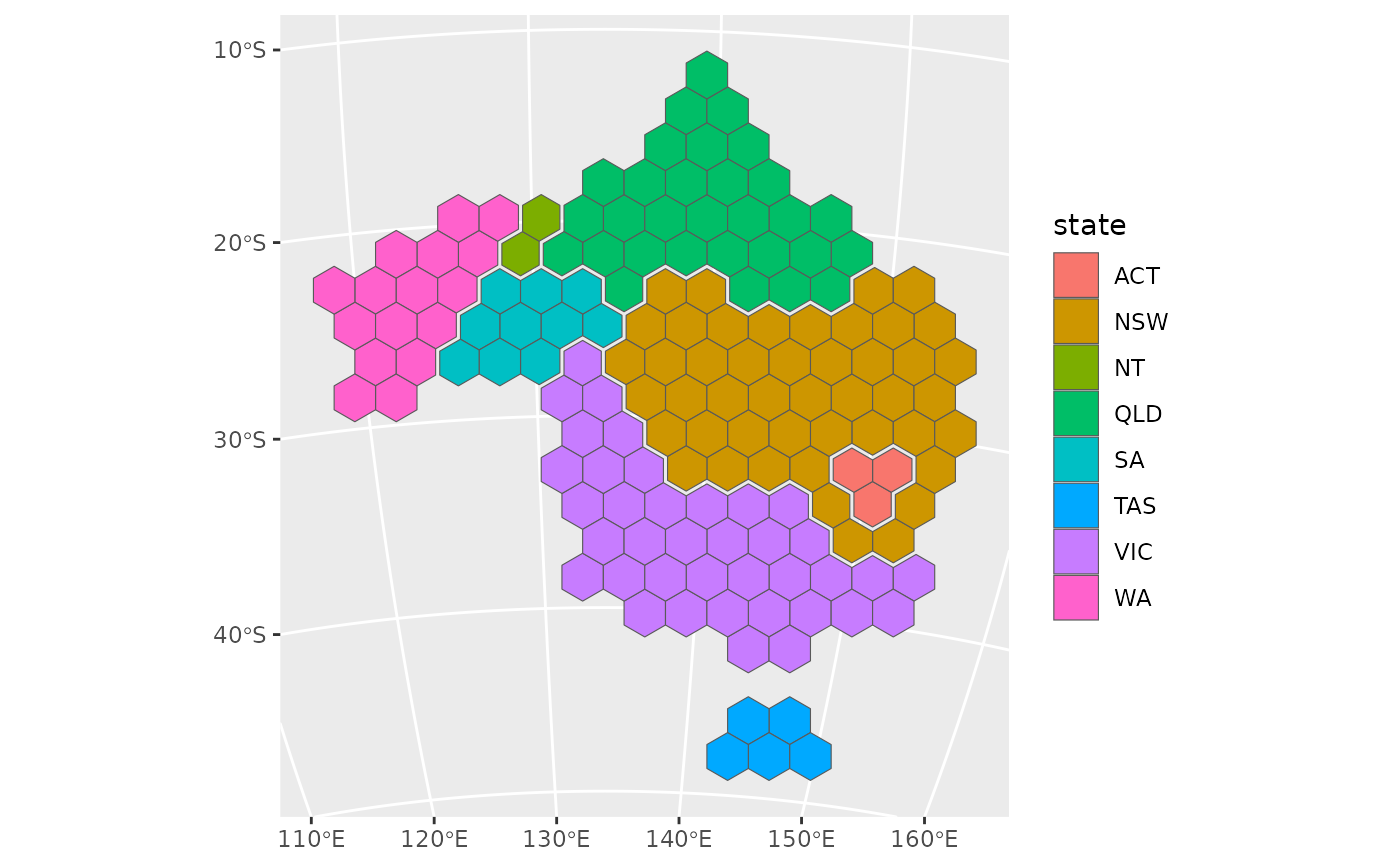
globe <- "+proj=ortho +lat_0=-25 +lon_0=134"
ggplot(hexmap(election, group = state, crs = globe)) +
geom_sf(aes(fill = state)) +
coord_sf(crs = globe)
 # }
# \donttest{
# Add the hexagons as a second geometry column, alongside the regions
election <- dplyr::mutate(election, hex = hexmap(geometry, group = state))
# }