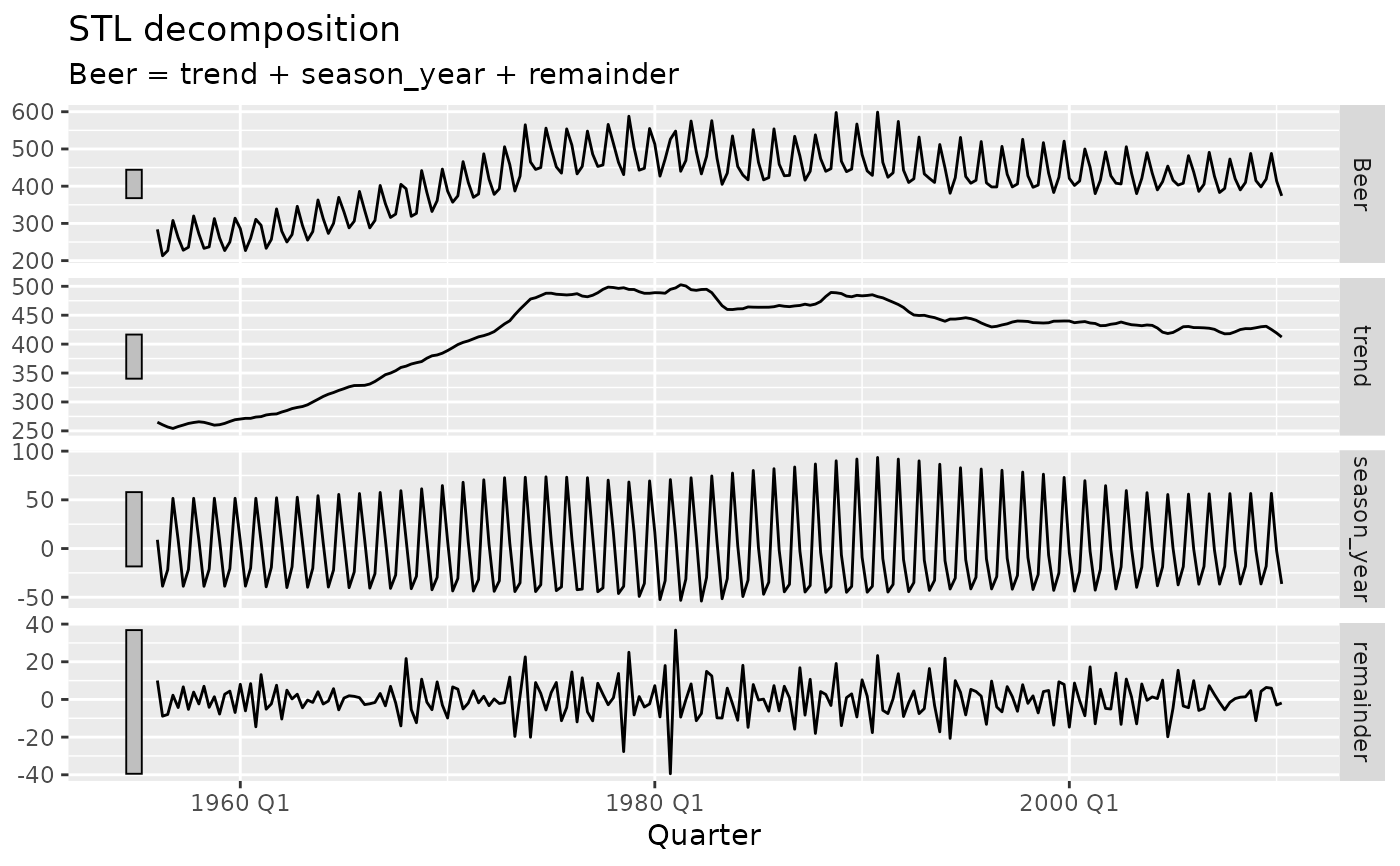
Produces a faceted plot of the components used to build the response variable of the dable. Useful for visualising how the components contribute in a decomposition or model.
Arguments
- object
A dable.
- .vars
The column of the dable used to plot. By default, this will be the response variable of the decomposition.
- scale_bars
If
TRUE, each facet will include a scale bar which represents the same units across each facet.- level
If the decomposition contains distributions, which levels should be used to display intervals?
- ...
Further arguments passed to
ggplot2::geom_line(), which can be used to specify fixed aesthetics such ascolour = "red"orsize = 3.
Value
A ggplot object showing a set of time plots of the decomposition.
Examples
library(fabletools)
library(feasts)
#>
#> Attaching package: ‘feasts’
#> The following objects are masked from ‘package:ggtime’:
#>
#>     gg_arma, gg_irf, gg_lag, gg_season, gg_subseries, gg_tsdisplay,
#>     gg_tsresiduals, scale_x_cf_lag
tsibbledata::aus_production %>%
  model(STL(Beer)) %>%
  components() %>%
  autoplot()